


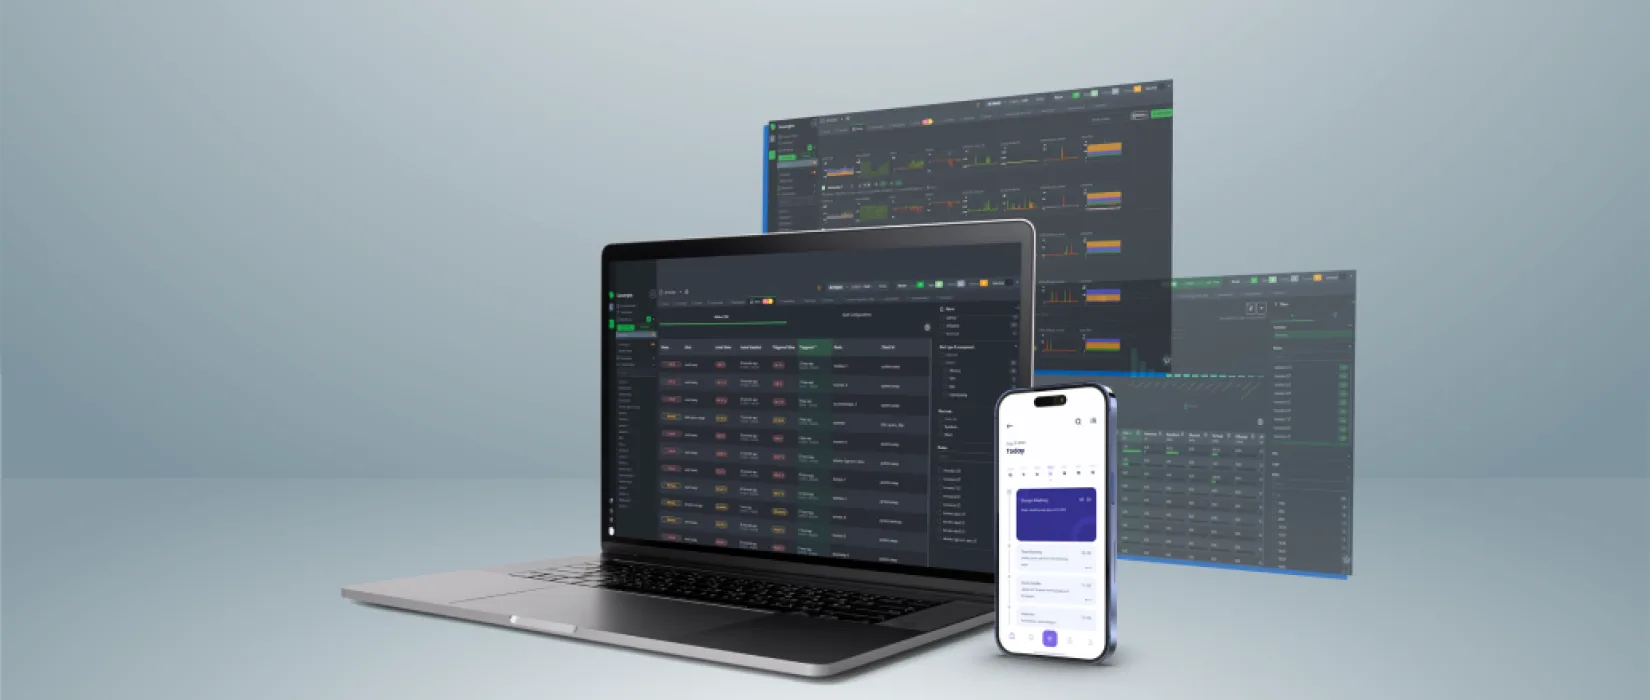
Application Performance Monitoring
Our real-time visibility layer for websites and web applications in production. We measure what users actually experience: uptime, response times, error rates, Core Web Vitals, database query performance and the health of third-party dependencies. AI-assisted diagnostics surface anomalies before they become user-visible incidents.
Knowing the site is online is not the same as knowing it is working
A site can return HTTP 200 to a basic uptime checker and still be broken for the people using it. Slow database queries, a third-party API quietly timing out, a JavaScript error firing on the checkout page, a CDN region serving stale assets, a Core Web Vitals score dropping below the threshold where it starts hurting search performance.
None of those will trip a "site is up" check. All of them affect what users experience. Application Performance Monitoring is the layer that watches what real users encounter rather than what a ping detects.
- Slow database queries behind a 200 response
- A third-party API timing out silently
- JavaScript errors firing on the checkout page
- Core Web Vitals drifting below a useful threshold
What the engagement produces
- A monitoring stack configured for your specific platform, not a generic template
- Dashboards you can read without an engineering degree
- Alerts routed to the right people, in the right channels, at the right severity
- Anomaly detection trained on your site's own normal pattern rather than fixed thresholds
- Automatically generated root-cause hypotheses, with false positives filtered before a human sees them
- A monthly summary of trends, regressions and recommendations
- Direct access to our engineering team when something needs investigating beyond the dashboard
- A simple uptime ping that emails you once the site is already down
- Security monitoring — a different problem needing different tooling
- A dashboard you have to read yourself every day for it to be worth anything
Seven signals, measured continuously
Availability and uptime
Multi-region uptime checks from outside the network, with alerting that goes to people rather than only to a dashboard.
Response times
Server-side response, time to first byte, full page load and time to interactive, measured continuously and trended rather than sampled.
Errors and exceptions
Application-level errors, PHP fatal errors, client-side JavaScript exceptions, and HTTP 4xx/5xx patterns.
Core Web Vitals
Largest Contentful Paint, Interaction to Next Paint and Cumulative Layout Shift — the metrics Google uses to assess real-user experience and factors into search.
Database performance
Slow query detection, connection pool health, lock contention and query trends. Most websites that "got slow lately" got slow at the database first.
Third-party dependency health
CRMs, payment gateways, marketing automation, analytics endpoints and other connected services watched for silent degradation.
Synthetic transactions
Scripted journeys through key flows — login, checkout, search — run on a schedule, so we know they still work before a real user discovers they do not.
Monitoring that gets acted on, not just stored
Anomaly detection over thresholds
Threshold alerting works for binary problems and fails for the everyday reality of drifting performance. A response-time pattern that is fine at 2pm Tuesday gets flagged at 4am Sunday, because the model knows what normal looks like for that site.
Signal over noise
Pure threshold alerting trains teams to ignore the dashboard. False positives are filtered before a human sees them, and low-severity items are batched rather than pushed.
Data that drives the work
Monitoring is most valuable paired with Managed Hosting and Platform Care, because the data informs the next maintenance window. A slow query trend leads to a database optimization; a Core Web Vitals regression after a content update leads to a frontend review. Without it, those calls get made on hunches.
Standalone where that is what you need
We also run monitoring for clients who host and maintain their sites elsewhere but want professional-grade observability.
Frequently asked questions
Application performance monitoring (APM) is the practice of continuously measuring how a website or web application performs in production from the perspective of real users. It covers uptime, response times, error rates, Core Web Vitals, database health, and the behaviour of integrated third-party services.
Basic uptime monitoring sends a request every few minutes and alerts you if the site does not respond. APM goes further: how fast it responds, where the time is spent, what errors are occurring, what users experience on different browsers and devices, and how all of that trends over time.
Yes. Analytics tells you what users did on your site; APM tells you how the site behaved while they were doing it. They answer different questions from different data. A site can have healthy analytics numbers and still be quietly losing customers to a Core Web Vitals regression analytics will never surface.
A combination of commercial tools and our own configurations tailored to each platform. The specific stack depends on what you are running and what you need visibility into. We recommend the stack as part of the engagement scope rather than locking every client into one vendor.
Yes. APM is host-agnostic. As long as we can install the monitoring agents or use external monitoring endpoints, the platform you run on does not matter.
Alerts route to the channel and people defined in the engagement. Critical-severity alerts go out immediately; lower-severity items are batched into daily or weekly digests so the inbox does not become noise. Routing is part of the setup conversation, not an afterthought.
Stop finding out about problems from your users
Proactive monitoring means fewer surprises, faster resolution and a better experience for everyone who depends on the application. It is most useful when the data feeds the maintenance work rather than sitting in a dashboard nobody opens.