As 2025 draws to a close, it’s a good time to review how the web has evolved over the past year. From traffic patterns and user behavior to mobile usage and design performance, the numbers tell a clear story about how websites are being built, accessed, and experienced.
We’ve compiled a selection of must-know website statistics in 2025, based on independently published research and industry benchmarks. The data covers key areas such as general website activity, UX trends, mobile behavior, traffic sources, and conversion metrics—offering a snapshot of what defined the web this year.
General Website & Internet Usage Statistics
This section highlights the scale and usage of the internet in 2025, including the number of active websites, global internet adoption, and the dominance of major platforms and search engines. These figures provide context for how people access and interact with online content at a global level.
1. Over 1.2 billion websites exist globally; only ~15% are active.
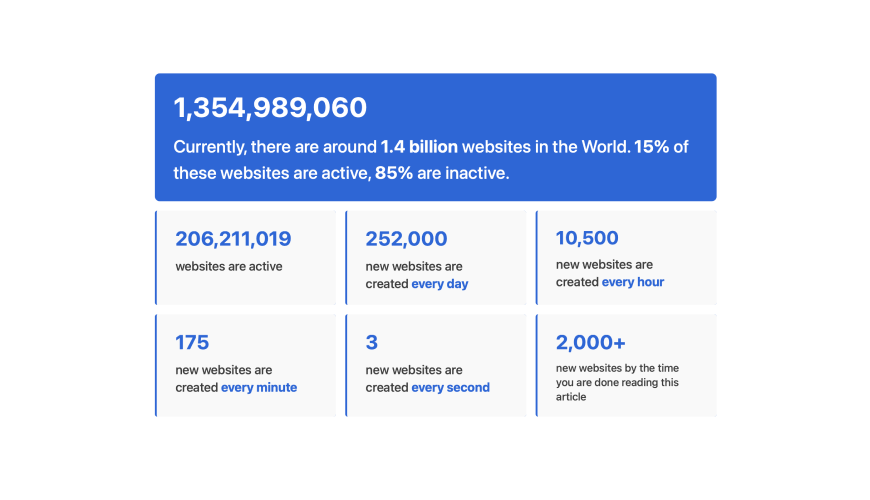
As of October 2025, there are more than 1.2 billion websites online. However, only around 16% of them are considered active—meaning they are maintained and updated regularly. The rest remain dormant, inactive, or abandoned.
2. Internet penetration has reached 68% of the global population.
Approximately 5.56 billion people around the world use the internet, representing about 68% of the global population. This continued growth in connectivity expands the reach and impact of web-based platforms, services, and content.
3. Google, YouTube, and Facebook are the most visited websites worldwide.
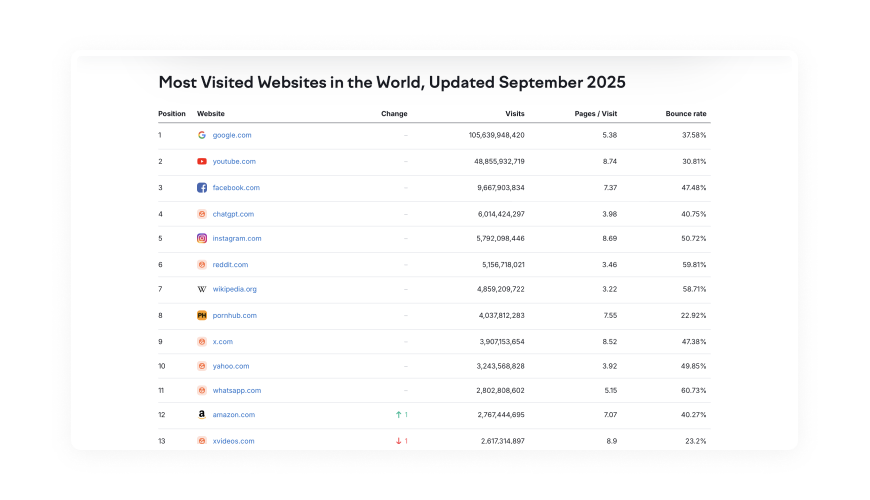
Google continues to lead as the most visited website globally, followed by YouTube and Facebook. These platforms dominate web traffic due to their roles in search, content consumption, and social interaction, accounting for a substantial share of global user engagement.
4. Google drives nearly 90% of global online traffic.
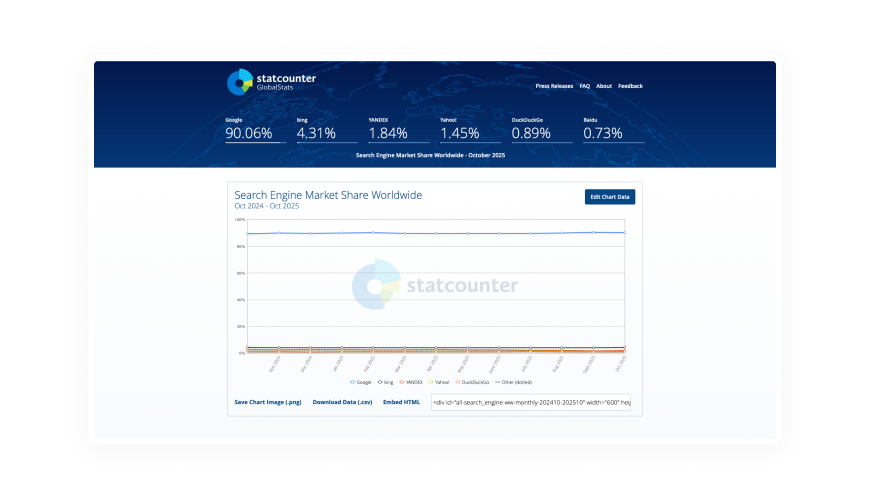
Google holds a dominant 90.04% share of the global search engine market. This overwhelming presence reinforces the importance of search engine visibility, making SEO a critical component for any web strategy targeting organic traffic.
Top Website Stats in 2025 Under User Behavior and Experience (UX)
This section focuses on how users interact with websites in 2025. From load time expectations and bounce rates to content engagement and frustration signals, these statistics reflect what users value—and what drives them away.
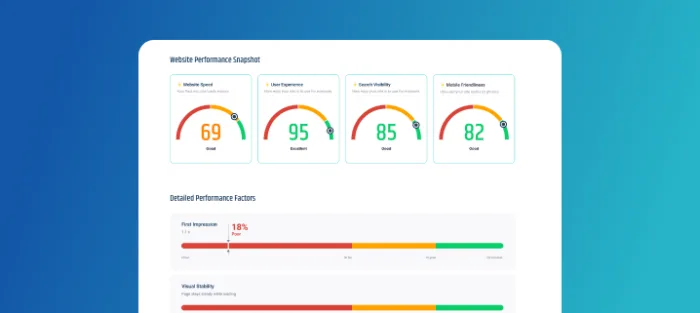
1. 94% of first impressions are design‑related, formed in about 0.05 seconds.
Research shows users make a snap evaluation of a website’s design—visual appeal, layout and clarity—typically within 50 milliseconds (0.05 seconds), and for 94% of users that initial impression hinges on design elements.
2. Most users won’t wait longer than 3 seconds for a site to load.
Website speed remains a critical UX factor. Around 53% of users will abandon a page if it takes longer than three seconds to load, with mobile users even less patient. This makes performance optimization essential for retaining visitors.
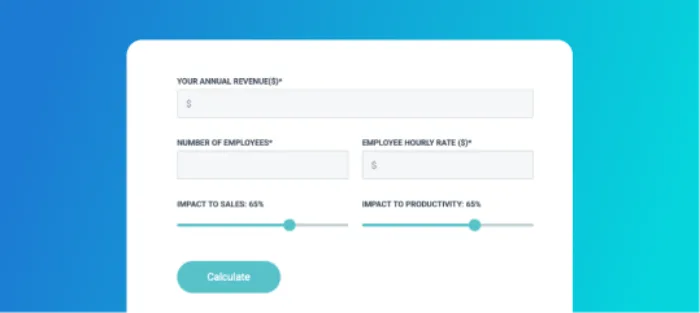
3. The average conversion rate across industries is about 2.9%.
In 2025, businesses across fourteen major sectors report an average conversion‑rate (form, call or sale) of roughly 2.9%. While performance varies significantly by industry, this gives a useful benchmark for digital experience effectiveness.
4. Scroll depth dropped to about 55% of a page on average in 2025.
Users are generally viewing just over half of a typical web page before moving on—meaning key content and calls‑to‑action placed further down may go unseen.
5. 84% of users report difficulty completing a transaction on mobile, and 88% won’t return after a poor experience.
A 2025 study found that 84% of mobile users faced hurdles when trying to complete tasks on a website via smartphone, while 88% of online consumers stated they’re less likely to revisit a site after encountering a bad user experience.
6. On average, visitors trigger 53 rage‑clicks per session on websites with UX issues.
Frequently during a session, users will repeatedly click—sometimes dozens of times—in rapid succession on elements that don’t respond as expected, such as broken buttons or slow‑loading features. These “rage clicks” serve as strong signals of friction and frustration in the user experience.
Business and Design Trends
This section covers how businesses are using websites in 2025, with a focus on design priorities, mobile responsiveness, e-commerce performance, and emerging technologies like AI. These trends reflect the growing expectation that websites not only represent a brand, but actively drive conversions and improve user engagement.
1. 73% of small businesses in the U.S. have a website.
The number of small businesses with an online presence has steadily increased over the past few years. In 2025, about 73% of small businesses in the United States report having a website, reflecting a broader shift toward digital visibility as a core business requirement.
2. Mobile devices generate over 62% of global web traffic.
Mobile devices accounted for approximately 62.45% of all internet traffic worldwide, underscoring the necessity of adopting a mobile‑first design approach.
3. Average e‑commerce conversion rates hover between 2% and 4%.
Recent benchmarking shows that most e‑commerce sites are converting around 2% to 4% of visits into sales in 2025—the exact figure depends on industry, device and traffic source.
4. Nearly 93% of web designers now use AI tools in their workflows.
Industry data indicate that approximately 93% of web designers have incorporated artificial‑intelligence tools into their design processes—leveraging automation, layout generation, imagery production, and other AI‑enabled capabilities.
Final Thoughts |
|---|
The data from 2025 paints a clear picture: having a website is no longer enough. Performance, usability, mobile optimization, and design quality all directly influence how users interact with digital experiences—and whether they convert. Whether you're reviewing your current site or planning a new build, these statistics offer useful benchmarks for evaluating priorities. From load times and mobile UX to conversion rates and AI adoption, the trends point toward one conclusion: the most effective websites are the ones built with user behavior, business goals, and future readiness in mind. |