You may have hundreds of excellent ideas about designing a website or a landing page but if you don’t test the concept with your audience, the final result may miss the point. Testing is an important tool to validate that your ideas about user interaction reflect reality.
While designing UI, even the slightest variations could change the outcome of a campaign, get those click-through rates up, and help you fix problems before they substantially affect your business targets.
A website is never a final product. This is especially true in view of dynamic user interactions with a growing business. The easier you get and analyze those interaction insights, the faster you’ll be able to respond with appropriate design and redesign actions and pull out the maximum in the design process.
When it comes to website optimization tools, they often come with a complicated presentation of metrics that don’t immediately show the areas of the site that could do better. Numbers alone are difficult to analyze. Most importantly, marketers and designers need to back up all UI design decisions with evidence and not shoot in the dark. Seeing those dynamic numbers visually is much easier to grasp. Therefore, visual data analysis using heatmaps is commonly used among designers, digital marketers, and product managers.

What are heatmaps and how are they used in UI design?
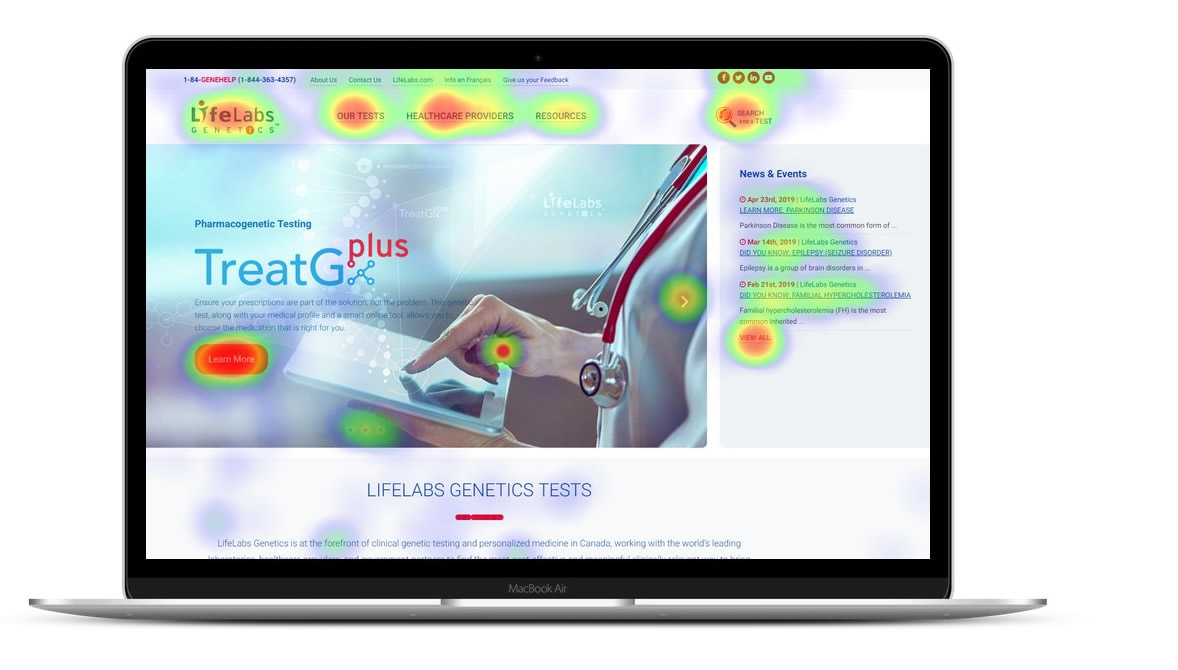
Heatmaps are a graphic representation of metrics about user interaction with a website or an app. Heatmaps software creates visual analytics by collecting insights when users move the mouse, tap or scroll across the touchscreen.
Heatmaps use a color code system to represent validated, usually two-dimensional data. The color variations identify areas for improvements that could be used to enhance UI. Temperature charts frequently seen on TV weather updates are a simple example of how heatmaps are used outside of the context of UI.
For example, if you have an important CTA button with a message that lacks clarity, you can lose valuable clicks because you didn’t know that it was the message that brought down the numbers. You need to know what’s the underperforming interaction area to optimize UI, including navigation, images, text, layout, and enhance overall user experience. Heatmaps help you identify areas users pull away from because they find them either confusing or overly complex and don’t use them as intended.
Heatmaps are especially useful when dealing with large volumes of data since colors are easier to distinguish and make sense of than raw numbers. Designer teams can share data across different team members, get feedback and adjust UI accordingly. The simple visualization of raw data in heatmaps is their most powerful feature.
Types of heatmaps
 UI designers get insights about user interaction with website content via three main types of heatmaps:
- Move heatmaps represent areas where users move the cursor of the mouse.
- Click heatmaps represent areas in which users click or tap.
- Scroll heatmaps represent scroll down areas on a webpage.
Designing by following these heatmaps, helps UI designers get insights about the footprint of the user attention and use it in the best possible way when placing buttons, images, and text across a website.
Measuring heatmaps impacts business decisions
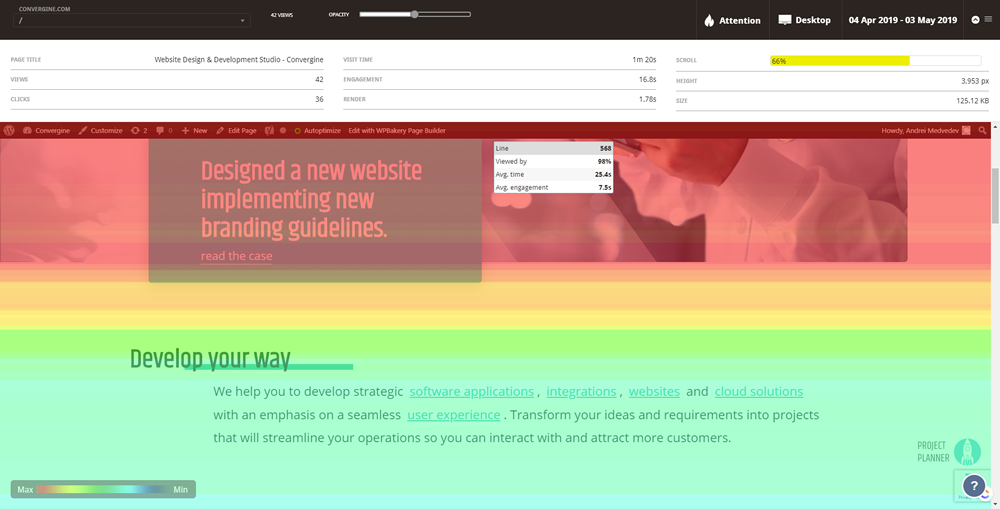 A heatmap is a powerful optimization tool that identifies the “hot” areas on a website. These are the spaces that capture real-time data on user behavior, where they spend most of their time, what they do and what they don’t. These insights are critical to making business decisions.
If you know what area of your website users interact with the most, you can use this information to place content, adjust design elements, including important CTA buttons and images, optimize the site performance by improving conversion rates.
Heatmaps work well with an established website when you run a marketing campaign and need to test your landing page by verifying design assumptions. It is an indispensable tool for marketers to remove guessing game out of the picture, make informed decisions to ensure a website performance meets specific business targets.
In the world of web design, things change quickly. Customer needs evolve, technology and tools constantly progress, what worked yesterday doesn’t mean will work tomorrow. The only thing that should always stay the same is the importance to know and understand the audience you design for. Using the right tool, such as heatmaps, will enable you to deliver intuitive customer experience through a better UI design and optimize your website performance by improving conversions.