Engaging in conversations with pur clients about data-driven design and why it’s needed can be quite a challenge. It frequently comes across as a complex and abstract concept, leaving them pondering, "What's in it for me, and why should I invest more to obtain a groundbreaking digital solution?". However, the real twist lies in the fact that an effective design goes beyond aesthetics; it's about delivering a seamless and engaging user journey that provides tangible results and meets user expectations. Designers are not users, and this is where data-driven design approach comes into play. It eliminates assumptions, puts personal (gut) feelings aside, and let designers create a truly customer-centric product.
In this post, we cover the basics of data-driven design and how it contributes to an effective, customer-centric digital solution that makes your audience meaningfully engage with your brand.
Data-driven design in a nutshell
It is a method that incorporates the art of design with data science. It's an approach that takes subjective design decisions or our assumptions and replaces them with accurate data received from various resources. Today, when every brand strives for an accessible and intuitive user experience, relying on assumptions and guesses seems reckless and can be a costly bet.
Types of data
Data-driven design comes from two main sources: quantitative and qualitative data. You can think of them as the "what" and "why" of user behavior.
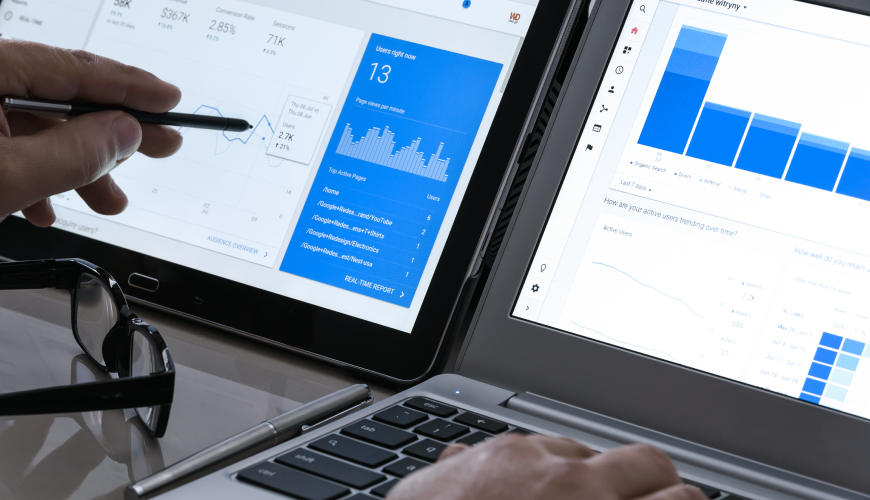
- Quantitative Data: It's all about numbers measuring user interactions. Metrics like page views, click-through rates, bounce rates, and conversion rates reveal what users are doing on your digital platform.
- Qualitative Data: This demonstrates the psychology of user behavior, uncovering the motivations, needs, and pain points. Qualitative data is usually collected through methods like interviews, surveys, and user testing.
Data Sources
There is an array of tools providing different types of data, and we want to highlight the most common ones:
1. Analytics tools
Google Analytics, social media analytics, email analytics, etc., provide designers with valuable quantitative data on user behavior, demographics, and engagement.
2. Usability testing
Real user testing sessions reveal how users interact with your design, exposing pain points and areas for improvement. For instance, a design team could run a usability test on a new registration process and identify that users encounter difficulties in locating the 'Sign Up' button, prompting a redesign to enhance its visibility and streamline the user flow.
3. A/B Testing
This method, also known as split testing, is used to compare two versions of a webpage, promo, or app to identify which one performs better. Thanks to this approach, designers can change the design elements to maximize better performance.
4. Heatmaps & click tracking
These tools are commonly used to show user interactions, shedding light on what web elements engage users and where improvements are needed. For example, a design team might use heatmaps and click tracking to visualize user interactions on a website, allowing them to pinpoint areas that receive the most and least engagement. This information can guide design adjustments and enhancements, ultimately improving the user experience.
User surveys & interviews
Gathering direct feedback from user groups through surveys and interviews provides rich qualitative data that can impact design decisions. For example, through the interviews, you can uncover that navigation is confusing and makes it difficult for users to locate certain important materials.
The Implementation Process
The process of collecting and turning data into meaningful and functional design is a multiple-step process that requires commitment, ongoing communication, and expertise. Here is a sneak peek into the key steps:
- Knowing the goals clearly: define what you want to achieve. This will be your benchmark or KPIs to measure success.
- Collecting and analyzing data: as mentioned above, it can be quantitative or qualitative data from various sources. Depending on your goals, designers will know what and how to analyze.
- Iterate: This step involves making data-driven decisions that meet user and business needs. It may take multiple iterations or changes before the final version is ready for testing.
- Test-testing and A/B testing methods are essential to validate any design changes and make adjustments if required.
- Monitor and refine: it's important to measure the impact of design changes and iterate accordingly to ensure the best user experience.
Wrap up
In this post, we scratched the surface to provide a holistic understanding of data-driven design, why data matters, and how it can shape your business decisions. While collecting data is not a new concept and might not be the most challenging part, adopting a data-driven mindset and associated practices can be pretty demanding.
At Convergine, we bring to the table extensive experience in guiding our clients through this journey and helping them build effective digital solutions by leveraging the best design practices and tools.
Let's turn your data into actionable design insights. Take advantage of a free consultation call, and our experienced team will guide you through implementing effective data-driven practices.